Cryptocurrency trading can feel like a rollercoaster. Prices move fast, charts look confusing, and it’s easy to get caught up in hype. That’s where crypto trading indicators come in. These are tools that traders use to make sense of market data. Instead of guessing whether Bitcoin or Ethereum will go up or down, indicators give you signals based on technical analysis.
If you’re serious about trading, learning how to use the right indicators can make a huge difference. In this guide, we’ll break down the top 5 crypto trading indicators every trader should know, how they work, and why they matter.
1. Moving Averages (MA)
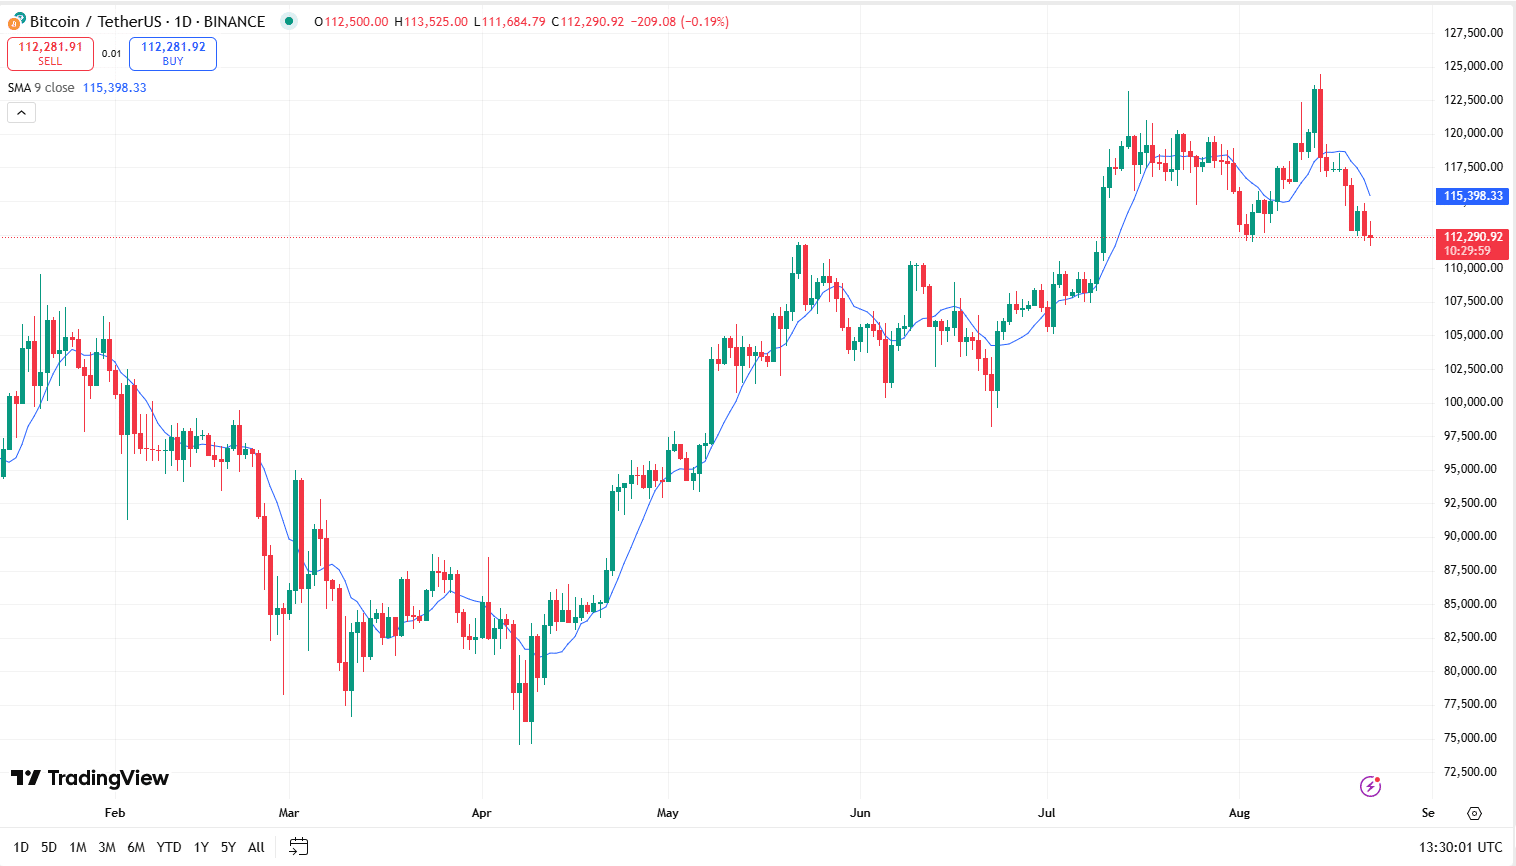
One of the simplest yet most powerful crypto trading tools is the moving average. It shows the average price of a coin over a set period—say 20 days or 50 days. By smoothing out price action, it helps you see the bigger trend instead of getting lost in short-term ups and downs.
- A Simple Moving Average (SMA) calculates the average closing price.
- An Exponential Moving Average (EMA) gives more weight to recent prices, making it more responsive.
Traders often use crossovers—when a short-term MA crosses above a long-term MA, it signals potential bullish momentum. When it crosses below, it could mean bearish momentum.
Why it matters: Moving averages help you figure out if the market is trending up, down, or just moving sideways.
2. Relative Strength Index (RSI)
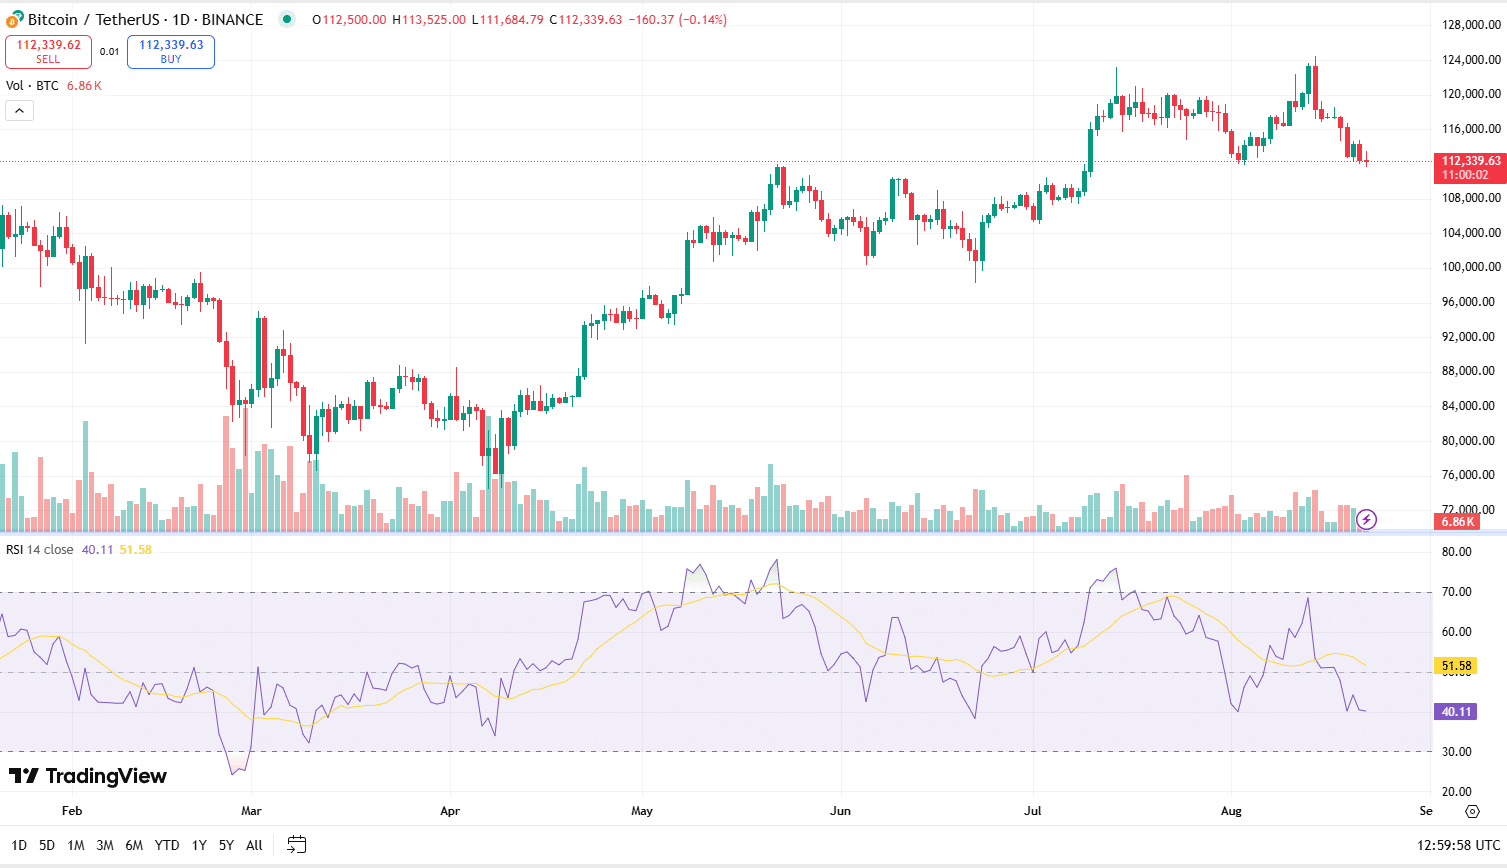
Ever wonder if a coin is “overbought” or “oversold”? That’s exactly what the RSI tells you. It’s a momentum indicator that ranges from 0 to 100.
- Above 70 usually means a coin is overbought (price may pull back).
- Below 30 means it’s oversold (price might bounce back).
For example, if Bitcoin suddenly spikes and the RSI shoots up to 80, it may be a sign that buyers are overdoing it, and a correction could follow.
Why it matters: RSI helps traders avoid buying at the top or selling at the bottom.
3. Moving Average Convergence Divergence (MACD)
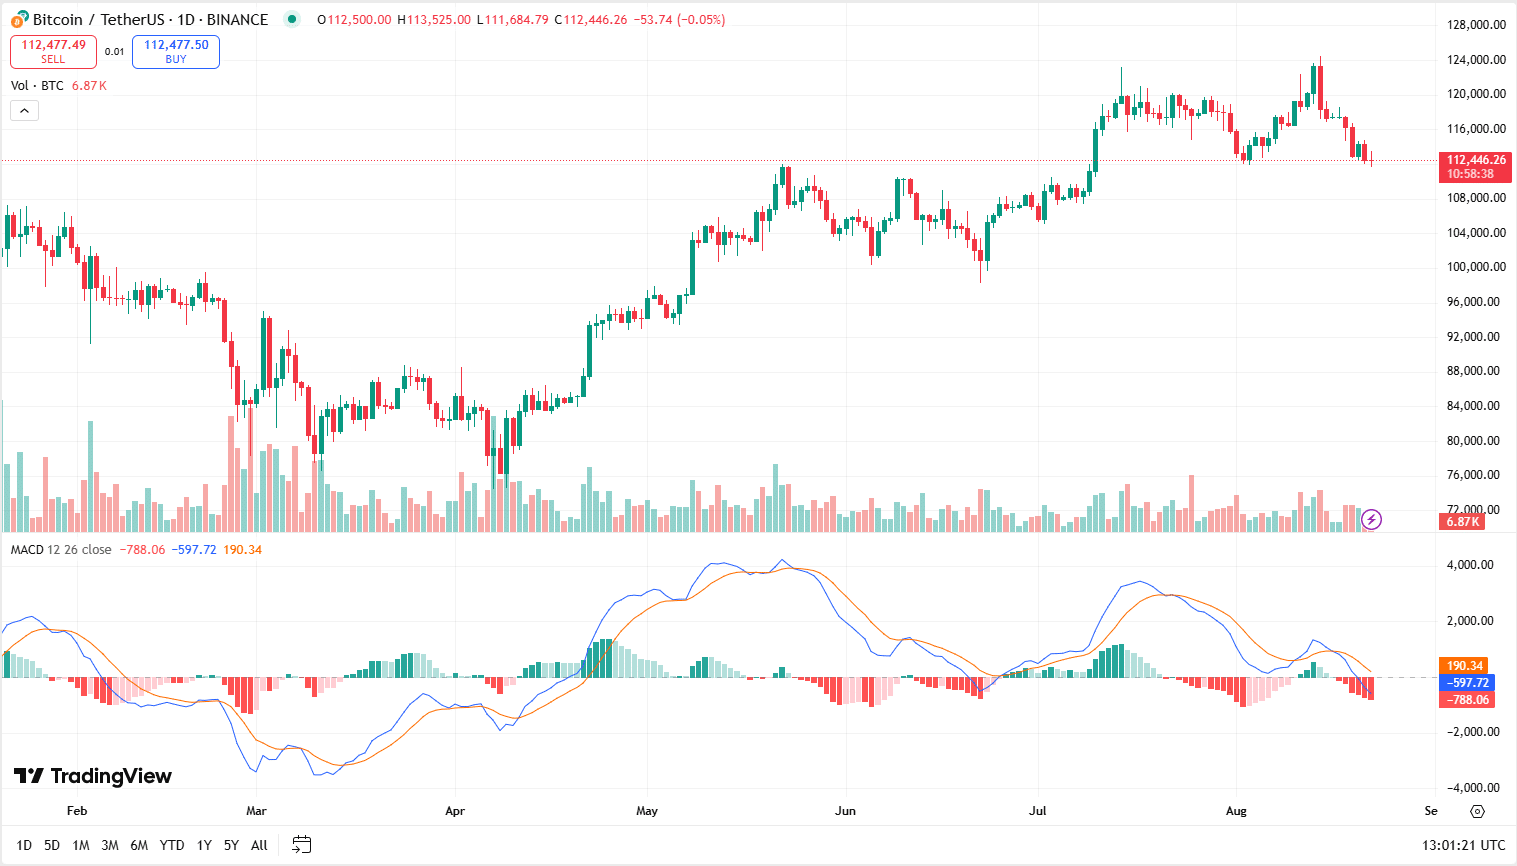
The MACD is a bit more advanced, but it’s a favorite among experienced traders. It looks at the relationship between two moving averages and generates buy or sell signals.
The MACD has two lines:
- The MACD line (difference between two EMAs).
- The Signal line (a smoothed average of the MACD line).
When the MACD line crosses above the signal line, it suggests upward momentum. When it crosses below, it signals downward momentum. Traders also watch the histogram, which shows the strength of the move.
Why it matters: MACD combines trend and momentum, making it a versatile tool for spotting potential reversals.
4. Bollinger Bands
Markets don’t just move in straight lines—they expand and contract. That’s what Bollinger Bands measure. They consist of three lines:
- A moving average in the middle.
- An upper band (price volatility high).
- A lower band (price volatility low).
When the bands are narrow, it means the market is calm, and a breakout could be coming. When the bands are wide, it shows high volatility and possible overextension.
For example, if Ethereum’s price touches the upper band repeatedly, it might be overbought. If it hugs the lower band, it could be oversold.
Why it matters: Bollinger Bands help traders spot volatility and potential breakout opportunities.
5. Volume Indicator
Price is one thing, but price with volume tells the real story. Volume shows how much of a cryptocurrency is being traded. A price increase with high volume is more reliable than one with low volume.
For instance, if Bitcoin breaks above a key resistance level but trading volume is weak, the breakout might not last. On the other hand, a strong move supported by high volume often confirms the trend.
Why it matters: Volume helps confirm whether price movements are real or just noise.
How to Use Indicators Together
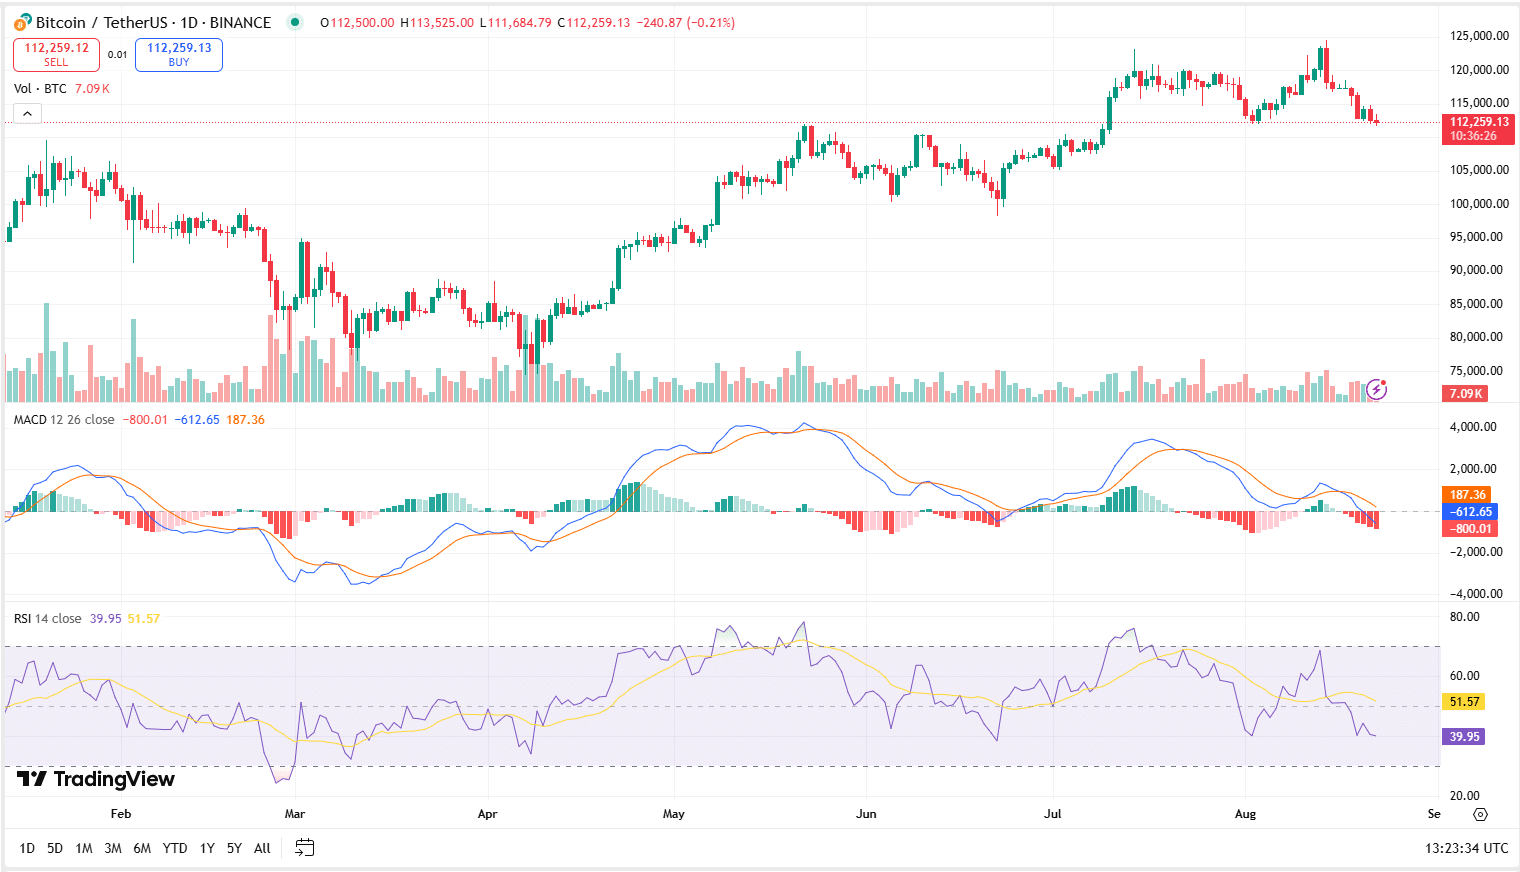
No single indicator can guarantee profits. Smart traders use a combination of indicators to confirm signals. For example:
- Use RSI to check if a coin is overbought.
- Combine it with MACD to confirm momentum.
- Check volume to make sure the move is real.
This layered approach reduces false signals and increases your confidence in trades.
Final Thoughts
The world of crypto trading can feel overwhelming, but once you start using technical analysis for crypto, things get clearer. The five indicators—Moving Averages, RSI, MACD, Bollinger Bands, and Volume—are must-have tools in your trading kit.


