After you complete a lesson make sure you click the "Mark Complete" button at the end of each lesson so you can advance to the next lesson. Want to watch the videos at a faster speed? Look for the GEAR icon in the bottom of the video player to adjust the playback speed.
*BETA - The tccBOT is a BETA release. Use at your own risk. Beta means it’s not perfect and there will be bugs. As with any BOT used in crypto it carries risk of losing your funds, especially if you do not take the time to go through the training in detail and use the built in stop loss features. Never invest funds that you can not afford to lose. If you use tccBOT please test for several weeks, develop your own strategies and only use a small part of your Portfolio when you go live. It is wise to focus on other areas of the program including Wavebot, TrendBot and general Range trading for maximum profits. DO NOT GO "ALL IN" ON tccBOT.
PLEASE WATCH THIS VIDEO FIRST SO WE CAN GET YOUR STARTED RIGHT AND SET EXPECTATIONS
Predictions Bot Charts To Copy
Here is the PancakeSwap Prediction 8.5 Alpha Chart.
NOTE - This is a 1 Min Chart Only Optimized for predicting on up and down arrows.
It's recommended you test this chart first BEFORE real predictions. We are still adjusting things on this chart but it should be ready for testing.
Use this link to set your referral https://prdt.app
IMPORTANT If you are already having massive success with one of the other charts keep using what works for you!
WHAT IS NEW
1. This is a 1 min chart only designed for predicting on Arrow Up and Arrow Down.
Here is the video that shows the strategy.
Please take note that if you get into a "Flat" zone you want to stop predicting.
Here is the PancakeSwap Prediction 8.1 Alpha Chart.
It's recommended you test this chart first BEFORE real predictions. We are still adjusting things on this chart but it should be ready for testing.
NOTE* The loaded pair is optimized for PRDT. If you want to use it for PancakeSwap Predictions load up the BNB/USDT Kucoin pairs
Use this link to set your referral https://prdt.app
IMPORTANT If you are already having massive success with one of the other charts keep using what works for you!
WHAT IS NEW
1. We have added a confidence percentage. Please note this is still in alpha. The percent confidence number given if for what is building at that moment. Use it to help you make your predictions on which directions things are going in the next 5 min. Many times this can help you catch the direction BEFORE you get UP/DOWN confirmations.
2. You can adjust the weighted percentages.
By default we have set:
Stoch 22
RSI 26
MACD 27
VWMA 20
These can be adjusted in your testing and will change the percentages. Feel free to use this in your testing if you wish.
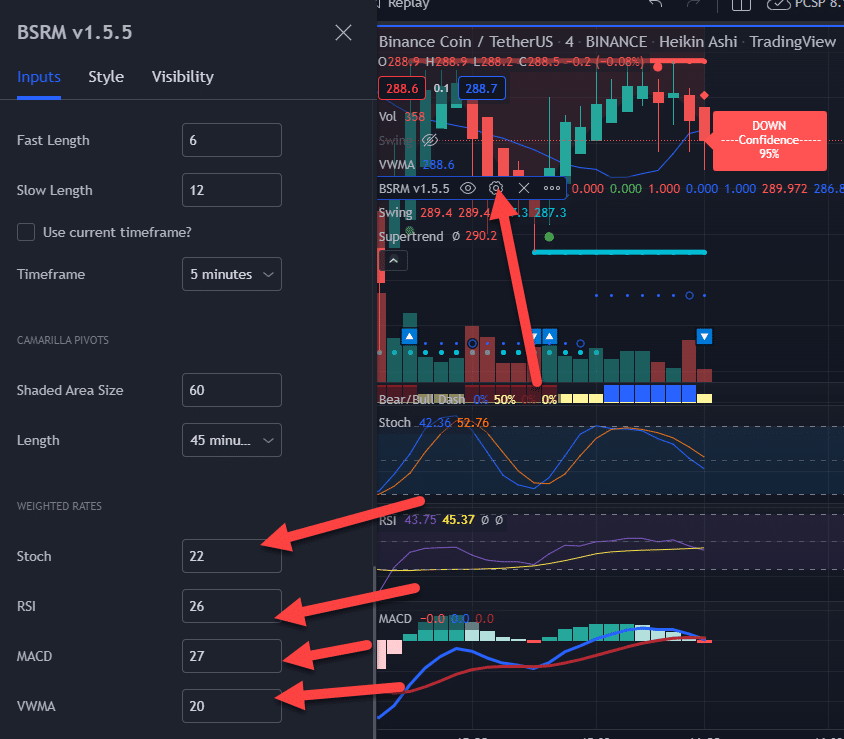
3. We added the VWMA indicator. You will notice a blue line that cycles up and down through the bars. When it crosses this gives a good indication of a cross up and down.
TIPS
Change your gas to Instant
Make your prediction at the 22 to 27-second mark when/if you see another candle on the 4 min chart or when you see confirmation on the 2 min chart.
Wait for the indicator to form or watch it start to form.
Watch the support and resistance solid lines (RED or GREEN Strong indicators are ones that BREAK UP or Down through the line. If they are playing back and forth on the lines that is a skip.
Basic rules if you are trading on the indicators.
Dot - A round dot (red/down) (green/up) means that it's possible it's going to get stronger in that direction. Be ready. Many times you want to skip these but pay close attention to the next bar on the 4 min chart.
2 Dots - I've found that if you get a candle with a dot and then another candle with a dot there is a good chance the next card will do the direction of the dot color (up or down)
Dot and then Diamond - Almost always a winner
Diamond. This is a strong indicator that the next card (closest to that bar) is going to do the direction. ESPECIALLY if it was proceeded by a round dot.
UP / Down - This is the strongest indicator and if they occur in your prediction window (22 to 27 seconds) or start to form they are statistically winners (but not always)
MACD UP/DOWN (Blue arrow) - In combination with a dot/diamond / up / down signal this is a good indicator that it's going to go in that direction (up or down) but not always. Use the other indicators with this.
NOTE! Sometimes you may see a UP or Down indicator or Dot or diamond but the wick or top or bottom of the bar is right on the support or resistance line and that is NOT a good time to go in. Especially if they are weak candles.
Here is the PancakeSwap Prediction 7.90 Beta Chart.
NOTE* With version 7.90 we have had amazing success with PRDT prediction.
Use this link to set your referral https://prdt.app
What the video why we are using this chart with PRDT. You can use it for PRDT or Pancake Swap Prediction.
IMPORTANT If you are already having massive success with one of the other charts keep using what works for you!
WHAT IS NEW
1. We changed some of the calculations to go more off of the MACD
TIPS
Change your gas to Instant
Make your prediction at the 22 to 27-second mark when/if you see another candle on the 4 min chart or when you see confirmation on the 2 min chart.
Wait for the indicator to form or watch it start to form.
Watch the support and resistance solid lines (RED or GREEN Strong indicators are ones that BREAK UP or Down through the line. If they are playing back and forth on the lines that is a skip.
Basic rules if you are trading on the indicators.
Dot - A round dot (red/down) (green/up) means that it's possible it's going to get stronger in that direction. Be ready. Many times you want to skip these but pay close attention to the next bar on the 4 min chart.
2 Dots - I've found that if you get a candle with a dot and then another candle with a dot there is a good chance the next card will do the direction of the dot color (up or down)
Dot and then Diamond - Almost always a winner
Diamond. This is a strong indicator that the next card (closest to that bar) is going to do the direction. ESPECIALLY if it was proceeded by a round dot.
UP / Down - This is the strongest indicator and if they occur in your prediction window (22 to 27 seconds) or start to form they are statistically winners (but not always)
MACD UP/DOWN (Blue arrow) - In combination with a dot/diamond / up / down signal this is a good indicator that it's going to go in that direction (up or down) but not always. Use the other indicators with this.
NOTE! Sometimes you may see a UP or Down indicator or Dot or diamond but the wick or top or bottom of the bar is right on the support or resistance line and that is NOT a good time to go in. Especially if they are weak candles.
Here is the PancakeSwap Prediction 7.84 Beta Chart.
IMPORTANT If you are already having massive success with one of the other charts keep using what works for you!
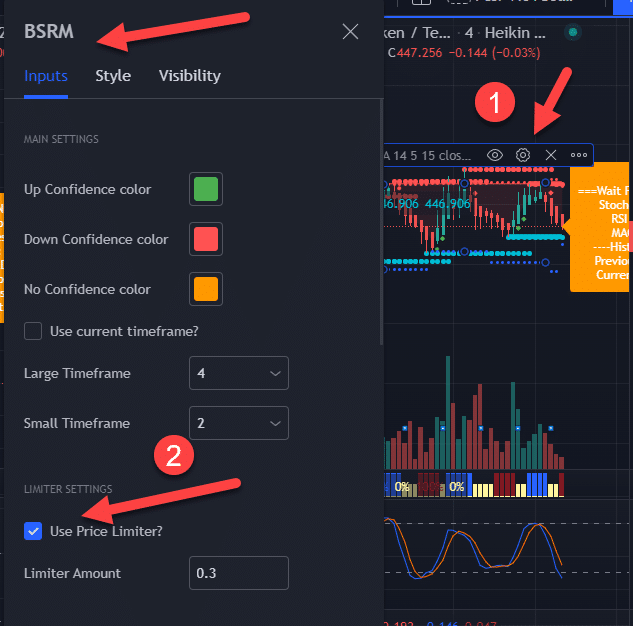
TRY TURNING ON THE LIMITER SO IT KEEPS YOU OUT OF SMALL CANDLES
WHAT IS NEW
1. We tightened up the conditions when you see an UP or Down signal
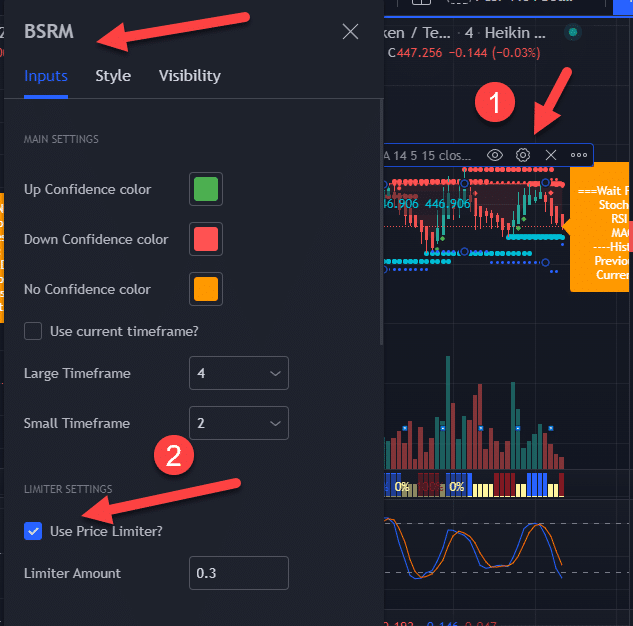
2. We added a "Price Limiter" so you can control the value where you will get an UP or DOWN signal. Default is .30 (30cents) meaning there has to be a change .30 before it will start to paint an UP or Down signal
THE LIMITER IS OFF BY DEFAULT - TURN IT ON AND TEST IT
TIPS
Change your gas to Instant
Make your prediction at the 22 to 27-second mark when/if you see another candle on the 4 min chart or when you see confirmation on the 2 min chart.
Wait for the indicator to form or watch it start to form.
Watch the support and resistance solid lines (RED or GREEN Strong indicators are ones that BREAK UP or Down through the line. If they are playing back and forth on the lines that is a skip.
Basic rules if you are trading on the indicators.
Dot - A round dot (red/down) (green/up) means that it's possible it's going to get stronger in that direction. Be ready. Many times you want to skip these but pay close attention to the next bar on the 4 min chart.
2 Dots - I've found that if you get a candle with a dot and then another candle with a dot there is a good chance the next card will do the direction of the dot color (up or down)
Dot and then Diamond - Almost always a winner
Diamond. This is a strong indicator that the next card (closest to that bar) is going to do the direction. ESPECIALLY if it was proceeded by a round dot.
UP / Down - This is the strongest indicator and if they occur in your prediction window (22 to 27 seconds) or start to form they are statistically winners (but not always)
MACD UP/DOWN (Blue arrow) - In combination with a dot/diamond / up / down signal this is a good indicator that it's going to go in that direction (up or down) but not always. Use the other indicators with this.
NOTE! Sometimes you may see a UP or Down indicator or Dot or diamond but the wick or top or bottom of the bar is right on the support or resistance line and that is NOT a good time to go in. Especially if they are weak candles.
Here is a Alpha 7.61 chart. Please read and watch the video and read the info for the 7.5 Alpha chart and then watch the video below.
This chart will require a pro+ account
IMPORTANT!
If you are already having massive success with one of the other charts keep using what works for you!
*** Note this Alpha chart might require a PRO+ account to see all the indicators.
Here is a 7.5 Alpha Chart. I'm calling it Alpha because it has a few new features and we are still programming a few things but my initial testing of this chart has me in the 75 to 83% range.
IMPORTANT!
If you are already having massive success with one of the other charts keep using what works for you!
What is new
1. Added Support and Resistance indicators. (Yellow lines). Watch the video on how you use them and how to position the cart so you can see between the gaps.
2. Added "Diamond" signals as we had added Circles in 7.4. Diamonds are a strong signal that it's going to go up or down in that direction for the next candle.
Tip.
Change your gas to Instant
Make your prediction at the 22 to 27-second mark when/if you see another candle on the 4 min chart.
Wait for the indicator to form or watch it start to form.
Watch the support and resistance yellow lines. Strong indicators are ones that BREAK UP or Down through the line. If they are playing back and forth on the lines that is a skip.
Basic rules if you are trading on the indicators.
Dot - A round dot (red/down) (green/up) means that it's possible it's going to get stronger in that direction. Be ready. Many times you want to skip these but pay close attention to the next bar on the 4 min chart.
Diamond. This is a strong indicator that the next card (closest to that bar) is going to do the direction. ESPECIALLY if it was proceeded by a round dot.
UP / DOwn - This is the strongest indicator and if they occur in your prediction window (22 to 27 seconds) or start to form they are statistically winners (but not always)
MACD UP/DOWN (Blue arrow) - In combination with a dot/diamond / up / down signal this is a good indicator that it's going to go in that direction (up or down) but not always. Use the other indicators with this.
NOTE! Sometimes you may see a UP or Down indicator or Dot or diamond but the wick or top or bottom of the bar is right on the support or resistance line and that is NOT a good time to go in. Especially if they are weak candles.
ALARMS
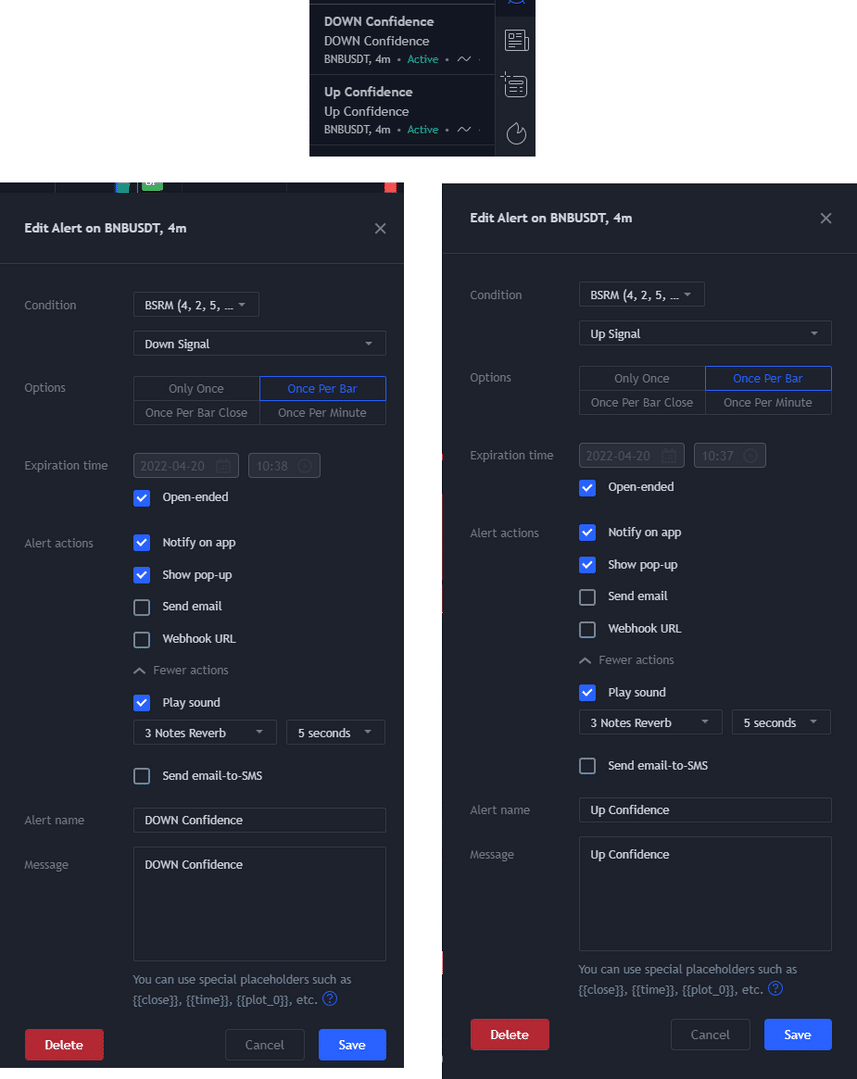
I am only setting 2 alarms right now UP and DOWN (you might have to clear your other alarms out on other charts)
![3913-image[1]](https://thecryptocode.com/wp-content/uploads/2024/09/3913-image1.png)
Here is a Beta 7.4 Chart.
IMPORTANT!
If you are already having massive success with one of the other charts keep using it.
The key difference with Beta 7.4 Are:
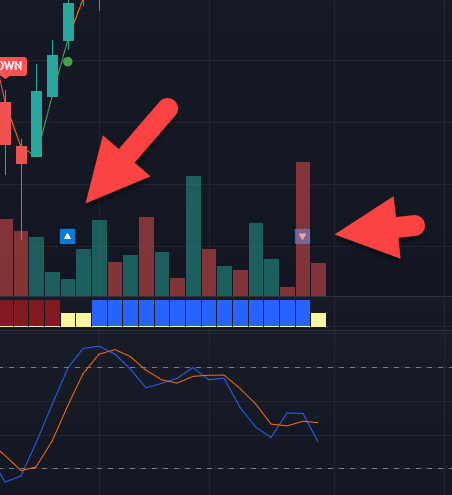
1. Added a new indicator on the Bear/Bull Dashboard. You will see an up or down arrow which indicates that the MACD is crossing and getting stronger. Many times we have found this makes a great prediction for the next card.
![3872-image[1]](https://thecryptocode.com/wp-content/uploads/2024/09/3872-image1.png)
2. We tweaked a few settings in the calculations to more accurately show the current candle
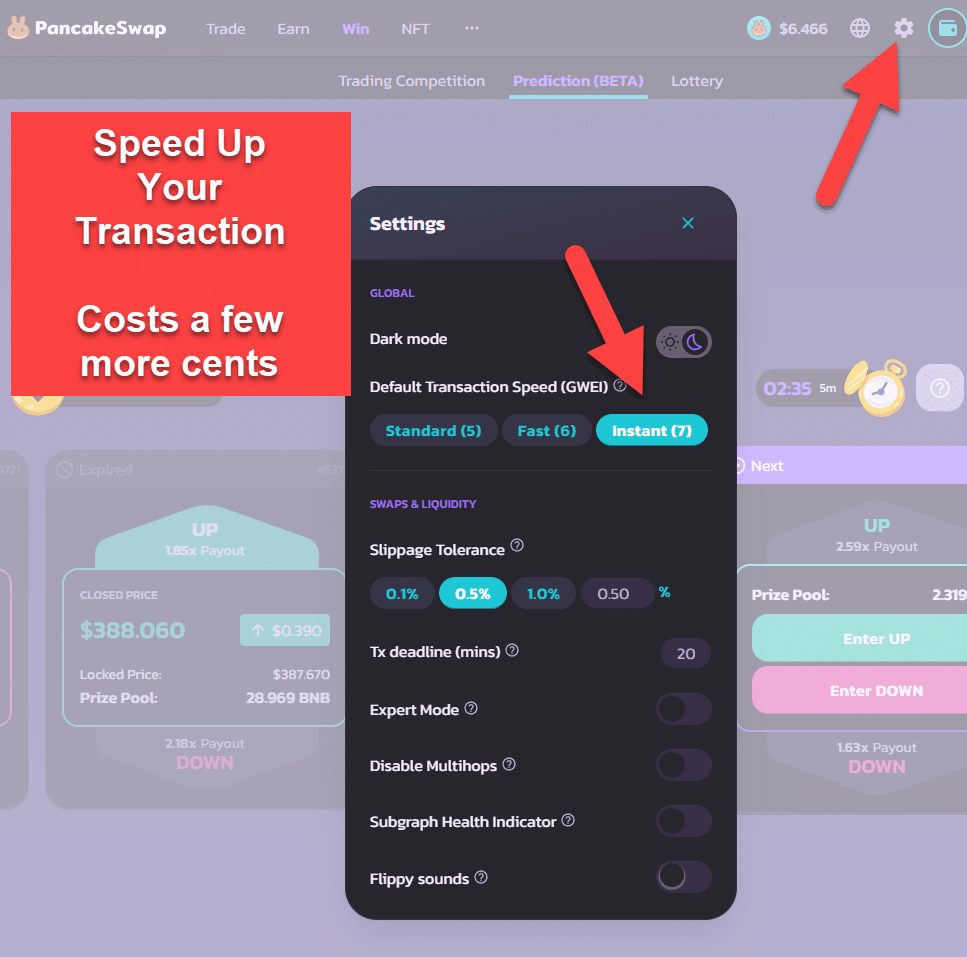
3. You may want to change your gas GWEI settings to fast as you can get a guess in at the 20-second mark and it only costs like 2 cents more
![3874-image[1]](https://thecryptocode.com/wp-content/uploads/2024/09/3874-image1.png)
Below is the chart. It has SUPER TREND turned off but after you copy the chart you might want to turn it on. This requires the pro+ account through as there are too many indicators for Pro
Here is a Beta 7.2 Chart.
IMPORTANT!
If you are already having massive success with one of the other charts keep using it.
The key difference with Beta 7.2 Are:
1. More of the MACD chart is used in the UP/DOWN Bar Indicators
2. Added a "Dot" on the bars where the dashboard is doing one direction but volume is going the other
3. Changed the main box info box to tell you "Wait for Marker" to be printed on the candle
PCS PREDICTION BETA 5 CHART
Here is a new Beta 5 chart. You will need to copy it into your account.
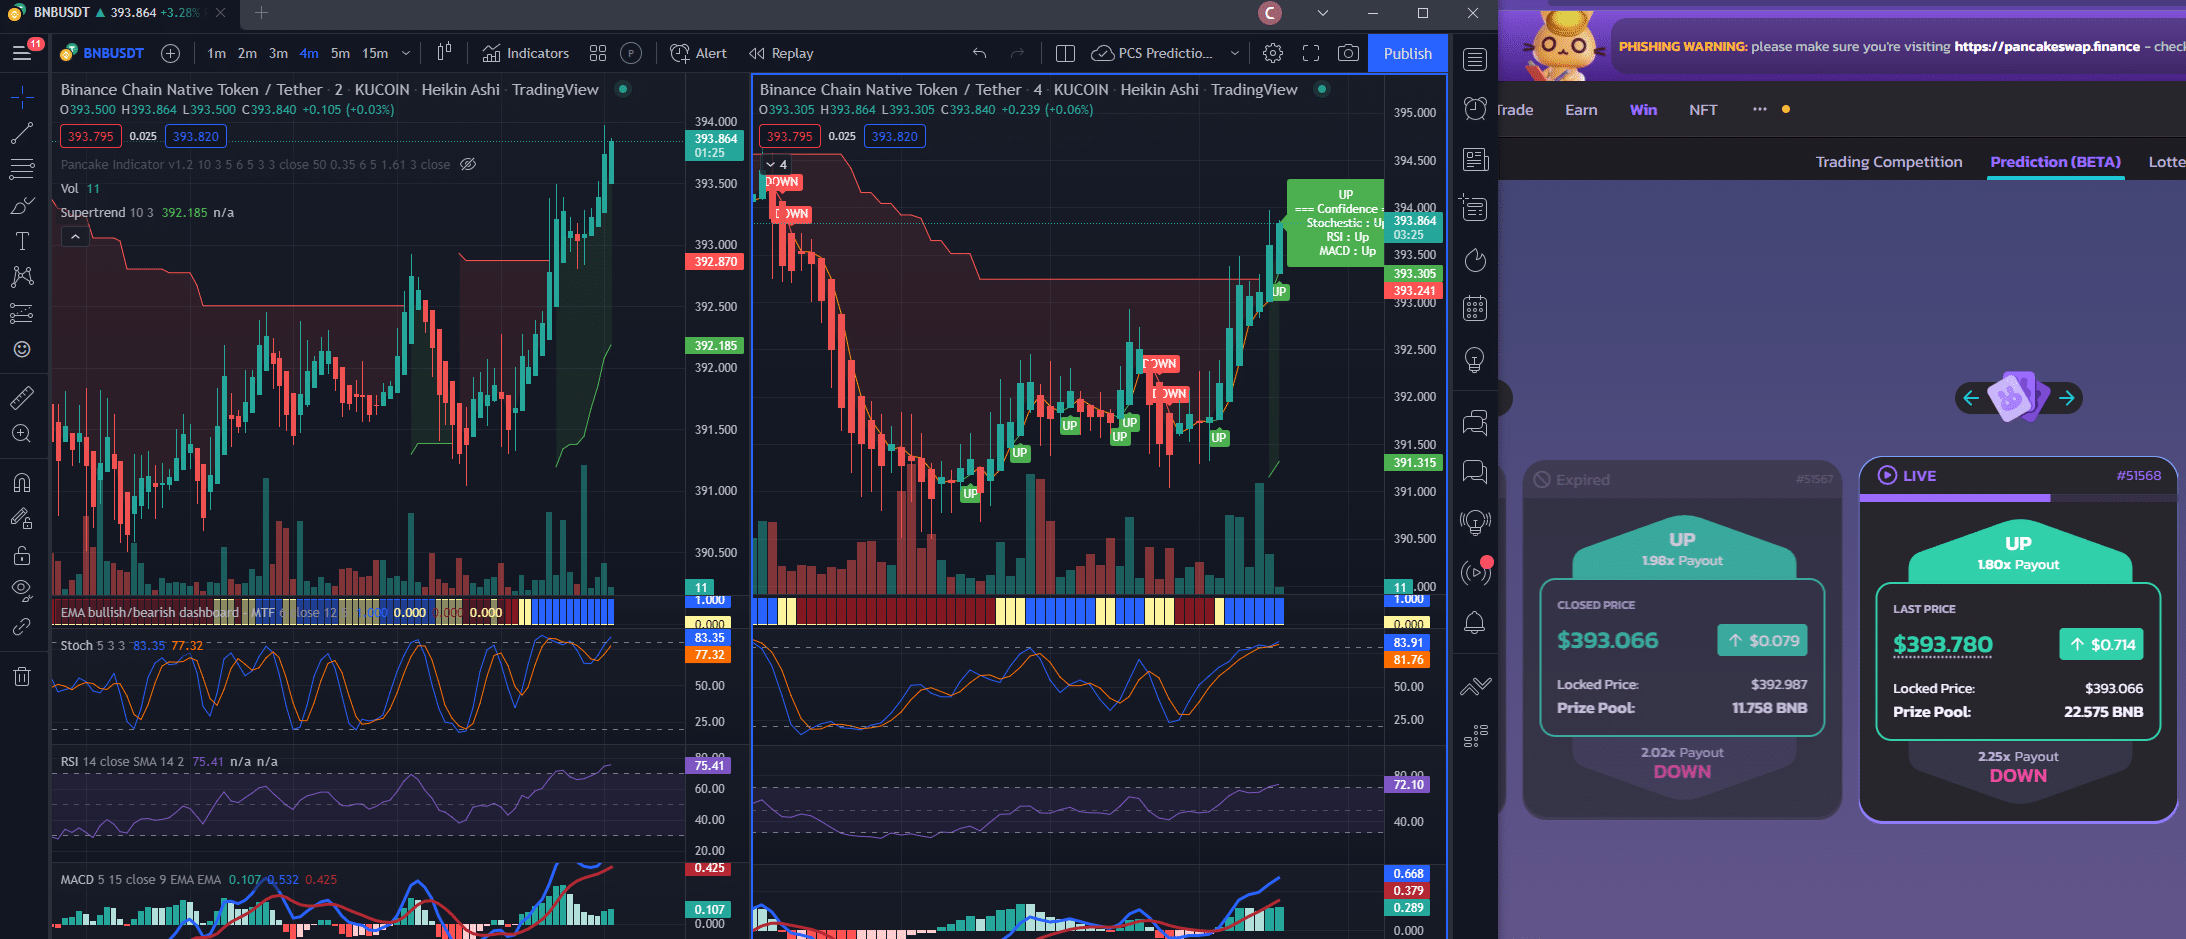
This new chart shows a 2 min on the left and 4 minute on the right.
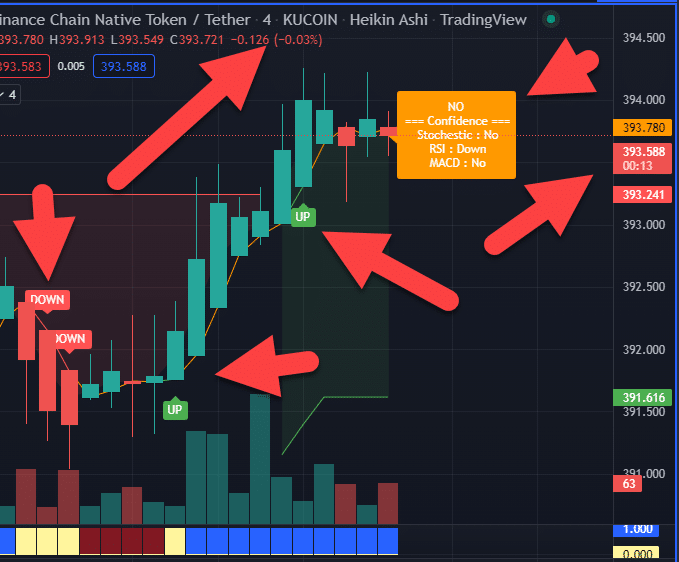
You will now notice on the 4 min it will tell you UP or DOWN on bars and give you a big indicator that has 3 status.
UP Confidence
Down Confidence
NO Confidence
IMPORTANT!!!!! Just because the bar or signal says up or down doesn't been it's going to be a winner 100% of the time!
What the indicator does is looks at all 6 indicators on the chart and when they are going in the Upward direction or Downward direction it will tell you up or down.
Please understand that timing is still very important. Watch the countdown timer on the chart and on the Pancakeswap Prediction card.
If it flips up or down and you have less than 90 seconds to make a decision that may be a good time to make your prediction.
It's possible the indicator may say UP and when it comes time for you to make your guess it flips NO so pay attention to the timing and still watch all the charts.
PAPER TRADE TILL YOU GET GOOD AT THIS!
and let everyone in the chat know how you are doing. It's helpful to team up and chat in real-time while you are doing it and get second opinions.
![3755-image[1]](https://thecryptocode.com/wp-content/uploads/2024/09/3755-image1.png)
![3756-image[1]](https://thecryptocode.com/wp-content/uploads/2024/09/3756-image1.png)
UPDATE 2/22/22
BETA 4 Chart and training video below. Please note the above video and chart that I talked about on 2/7/22 is still valid. This is a new chart on the 2 and 4 min that is getting us 70 to 84% win rate BUT we need more people to test it so it's beta. Remember to PAPER TRADE first to learn.
![3872-image[1]](https://thecryptocode.com/wp-content/uploads/2024/09/3872-image1.png)
2. We tweaked a few settings in the calculations to more accurately show the current candle
3. You may want to change your gas GWEI settings to fast as you can get a guess in at the 20-second mark and it only costs like 2 cents more
![3874-image[1]](https://thecryptocode.com/wp-content/uploads/2024/09/3874-image1.png)
Hey I just published a 2nd chart you can test here:
I added the TMA RSI Divergence indicator (THANK YOU ANRI!)
And took off the overbought / oversold
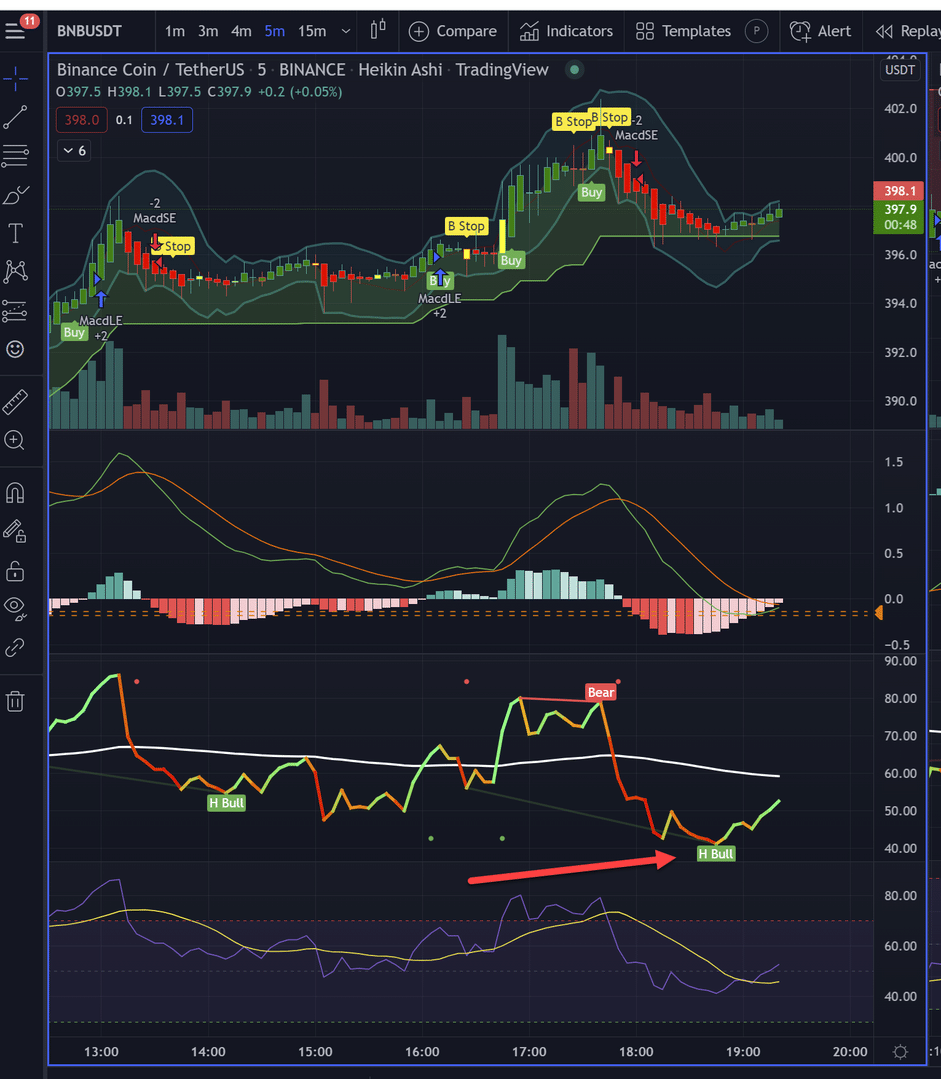
Watch that 5 min chart. When the BEAR or BULL signal on the 5 min chart triggers AND you see the MACD and the RSI all giving the Buy or Sell signals you will usually see 2 or 3 cards that go that direction.
So for looking very promising.
![3328-image[1]](https://thecryptocode.com/wp-content/uploads/2024/09/3328-image1.png)
8.5 Alpha
1. This is a 1 Min Chart Only Optimized for predicting on up and down arrows.
8.10 Alpha
1. We have added a confidence percentage. Please note this is still in alpha. The percent confidence number given if for what is building at that moment. Use it to help you make your predictions on which directions things are going in the next 5 min. Many times this can help you catch the direction BEFORE you get UP/DOWN confirmations.
2. You can adjust the weighted percentages.
3. We added the VWMA indicator. You will notice a blue line that cycles up and down through the bars. When it crosses this gives a good indication of a cross up and down.
7.90 Beta
1. Changed many of the indicators to follow the MACD
2. Several internal changes
7.84 Beta
1. We tightened up the conditions when you see an UP or Down signal
2. We added a "Price Limiter" so you can control the value where you will get an UP or DOWN signal. Default is .30 (30cents) meaning there has to be a change .30 before it will start to paint an UP or Down signal
7.61 Alpha
1. Internal tweaks
7.5 Alpha
1. Added Support and Resistance indicators. (Yellow lines). Watch the video on how you use them and how to position the cart so you can see between the gaps.
2. Added "Diamond" signals as we had added Circles in 7.4. Diamonds are a strong signal that it's going to go up or down in that direction for the next candle.
7.4 Beta
1. Added a new indicator on the Bear/Bull Dashboard. You will see an up or down arrow which indicates that the MACD is crossing and getting stronger. Many times we have found this makes a great prediction for the next card.
2. We tweaked a few settings in the calculations to more accurately show the current candle
3. You may want to change your gas GWEI settings to fast as you can get a guess in at the 20-second mark and it only costs like 2 cents more
7.2 Beta
1. More of the MACD chart is used in the UP/DOWN Bar Indicators
2. Added a "Dot" on the bars where the dashboard is doing one direction but volume is going the other
3. Changed the main box info box to tell you "Wait for Marker" to be printed on the candle
Tracking Spreadsheet For Paper and Real Predictions
Predictions Bot Strategies To Copy
Strategies posted here come from our internal testing and we do our best to bring winning strategies to you. There is NO GUARNATEE the the strategy will be a winner so please test test test. Sometimes a strategy works for a time and then changes. In these cases it's best to look at your data and see if you can spot the change in the trend and then modify the strategy or alert.
Always test before you use live funds. Always use a stop loss that matches your risk tolerance. Never predict with more than you can afford to lose.
Remember this is BETA. For best results test for several weeks, develop your own strategies and get plugged into the forums and chat where other members are developing and sharing other strategies.
This is not a magic money black box (yet) so please make sure you are testing before rolling out live funds and only use part of your portfolio. Make sure you are also focusing on other strategies taught in the program like WaveBot, TrendBot and general range trading.
PLEASE DO NOT GO "ALL IN" on tccBOT
SOMETHING IMPORTANT
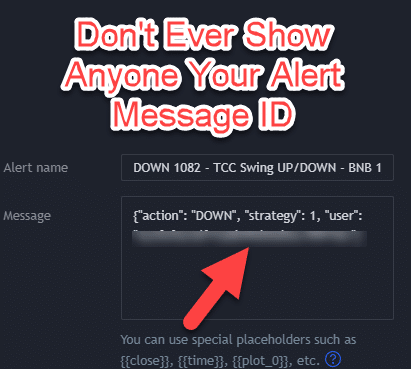
In the training I show you how to setup a TradingView Alert to send a signal to the bot... in that alert you add your MESSAGE that you get from the bot.
DO NOT SHOW THAT MESSAGE ID TO ANYONE.
Don't post it in the forums or chat because someone else could take that alert message and send signals to it and cause your bot to do predictions.
![6712-image[1]](https://thecryptocode.com/wp-content/uploads/2024/09/6712-image1.png)
STRATEGY #: 1082
STRATEGY NAME: TCC Swing UP/DOWN - BNB 1 Min - BNBUSDT Binance - Heikin Ashi - Once Per Bar - 60 - 30 - UP - DOWN - PCS
INDICATOR: TCC Swing UP/DOWN
PAIR: BNBUSDT BINANCE
INDICATOR LINK: https://www.tradingview.com/chart/SpZEpIGV/
BAR TYPE: Heikin Ashi
TV TIME: 1 MIN
TV OPTIONS: Once Per Bar
DIRECTION: UP/DOWN
PLATFORM: PCS
NOTE: Averaging 59% Win rate after 200 Predictions
WEBHOOK URL: https://tccbot.io/tradingview/ (make sure you put the / at the end or your signals will not be sent)
UP ALERT
![6683-image[1]](https://thecryptocode.com/wp-content/uploads/2024/09/6683-image1.png)
DOWN ALERT
![6684-image[1]](https://thecryptocode.com/wp-content/uploads/2024/09/6684-image1.png)
STRATEGY #: 1189
STRATEGY NAME: 1189 - Fractals(2) - 5MIN - BNB/USDT Binance - Heikin Ashi - OPB - 60/30 - UP/DOWN - PCS
INDICATOR: Fractals(2)
PAIR: BNBUSDT BINANCE
INDICATOR LINK: https://www.tradingview.com/chart/EiUALPGc/
BAR TYPE: Heikin Ashi
TV TIME: 5 MIN
TV OPTIONS: Once Per Bar
SIGNALS: Buy/Sell
DIRECTION: Moving UP/DOWN
PLATFORM: PCS
NOTE: ~56% strategy with PCS/CAKE. No scheduler
- YOU SHOULD HAVE CAKE TOKENS IN YOUR WALLET FOR PREDICTIONS AND BNB BALANCE FOR TRANSACTION/GAS FEES.
- THE CAKE TOKEN SHOULD HAVE BEEN ENABLED IN YOUR WALLET. IT IS REQUIRED TO DO AT LEAST 1 MANUAL PREDICTION ON HTTPS://PANCAKESWAP.FINANCE/PREDICTION?TOKEN=CAKE BEFORE SETTING UP THE BOT FOR CAKE PREDICTIONS.
WEBHOOK URL: https://tccbot.io/tradingview/ (make sure you put the / at the end or your signals will not be sent)
UP ALERT
![8054-image[1]](https://thecryptocode.com/wp-content/uploads/2024/09/8054-image1.png)
DOWN ALERT
![8055-image[1]](https://thecryptocode.com/wp-content/uploads/2024/09/8055-image1.png)
STRATEGY #: 1191
STRATEGY NAME: 1191 - Technicals(2) - 1MIN - BNB/USDT Binance - Heikin Ashi - OPB - 60/30 - UP/DOWN - PCS
INDICATOR: Technicals(2)
PAIR: BNBUSDT BINANCE
INDICATOR LINK: https://www.tradingview.com/chart/1kBkx5Q8/
BAR TYPE: Heikin Ashi
TV TIME: 1 MIN
TV OPTIONS: Once Per Bar
SIGNALS: Strong Buy/Sell
DIRECTION: UP/DOWN
PLATFORM: PCS
NOTE: Scheduler setting 4:00 UTC to 20:00 UTC (Stop Bot)
WEBHOOK URL: https://tccbot.io/tradingview/ (make sure you put the / at the end or your signals will not be sent)
UP ALERT
![8052-image[1]](https://thecryptocode.com/wp-content/uploads/2024/09/8052-image1.png)
DOWN ALERT
![8053-image[1]](https://thecryptocode.com/wp-content/uploads/2024/09/8053-image1.png)
STRATEGY #: 1190
STRATEGY NAME: 1190 - UP/Down volume - 1MIN - BNB/USDT Binance - Heikin Ashi - OPB - 60/30 - UP/DOWN - PCS
INDICATOR: UP/Down volume
PAIR: BNBUSDT BINANCE
INDICATOR LINK: https://www.tradingview.com/chart/g2OLZ6iS/
BAR TYPE: Heikin Ashi
TV TIME: 1 MIN
TV OPTIONS: Once Per Bar
SIGNALS: Moving UP/DOWN
DIRECTION: UP/DOWN
PLATFORM: PCS
NOTE: Scheduler setting 4:00 UTC to 14:30 UTC (Stop Bot)
WEBHOOK URL: https://tccbot.io/tradingview/ (make sure you put the / at the end or your signals will not be sent)
UP ALERT
![8050-image[1]](https://thecryptocode.com/wp-content/uploads/2024/09/8050-image1.png)
DOWN ALERT
![8051-image[1]](https://thecryptocode.com/wp-content/uploads/2024/09/8051-image1.png)
STRATEGY #: 1172
STRATEGY NAME: 1172 - TCC Trend - 3MIN - BNB/USD Binance - Heikin Ashi - OPB - 60/30 - UP/DOWN - PCS
INDICATOR: TCC Trend
PAIR: BNBUSD BINANCE
INDICATOR LINK: https://www.tradingview.com/chart/vWtsQDsl/
BAR TYPE: Heikin Ashi
TV TIME: 3 MIN
TV OPTIONS: Once Per Bar
SIGNALS: Long/Short
DIRECTION: UP/DOWN
PLATFORM: PCS
NOTE: Scheduler setting 4:00 UTC to 20:00 UTC (Stop Bot)
WEBHOOK URL: https://tccbot.io/tradingview/ (make sure you put the / at the end or your signals will not be sent)
UP ALERT
![7875-image[1]](https://thecryptocode.com/wp-content/uploads/2024/09/7875-image1.png)
DOWN ALERT
![7874-image[1]](https://thecryptocode.com/wp-content/uploads/2024/09/7874-image1.png)
STRATEGY #: 1169
STRATEGY NAME: 1169 - Accurate Swing - 3MIN - BNB/USDT Binance - Heikin Ashi - OPB - 60/30 - UP/DOWN - Cake
INDICATOR: Accurate Swing
PAIR: BNBUSDT BINANCE
INDICATOR LINK: https://www.tradingview.com/chart/n1KTCRmx/
BAR TYPE: Heikin Ashi
TV TIME: 3 MIN
TV OPTIONS: Once Per Bar
SIGNALS: Buy/Sell
DIRECTION: UP/DOWN
PLATFORM: PCS
NOTE: ~70% strategy with PCS/CAKE. No scheduler
- YOU SHOULD HAVE CAKE TOKENS IN YOUR WALLET FOR PREDICTIONS AND BNB BALANCE FOR TRANSACTION/GAS FEES.
- THE CAKE TOKEN SHOULD HAVE BEEN ENABLED IN YOUR WALLET. IT IS REQUIRED TO DO AT LEAST 1 MANUAL PREDICTION ON HTTPS://PANCAKESWAP.FINANCE/PREDICTION?TOKEN=CAKE BEFORE SETTING UP THE BOT FOR CAKE PREDICTIONS.
WEBHOOK URL: https://tccbot.io/tradingview/ (make sure you put the / at the end or your signals will not be sent)
UP ALERT
![7862-image[1]](https://thecryptocode.com/wp-content/uploads/2024/09/7862-image1.png)
DOWN ALERT
![7865-image[1]](https://thecryptocode.com/wp-content/uploads/2024/09/7865-image1.png)
Important Links:
Blockwallet.io - Recommended Wallet
Get Your TradingView Account
Request Your Indicators (if you haven't already in the WaveBot Fast Start)
Get Your Remote Server
Buy BNB (BEP-20) Token
Submit Your Wallet Address And Download The Bot
PancakeSwap Predictions
PRDT

![4338-image[1]](https://thecryptocode.com/wp-content/uploads/2024/09/4338-image1.png)
![4339-image[1]](https://thecryptocode.com/wp-content/uploads/2024/09/4339-image1.png)


